
灵感来源:在疫情期间,我们大部分时间都在家中度过,烹饪也因此成为居家生活的核心部分。因此在这个项目中,我收集了自己的日常饮食数据,通过分析来探究不同的餐饮因素如何影响我的用餐体验,并希望能找出最能给我带来满足感的饮食组合。
技能掌握:Javascript
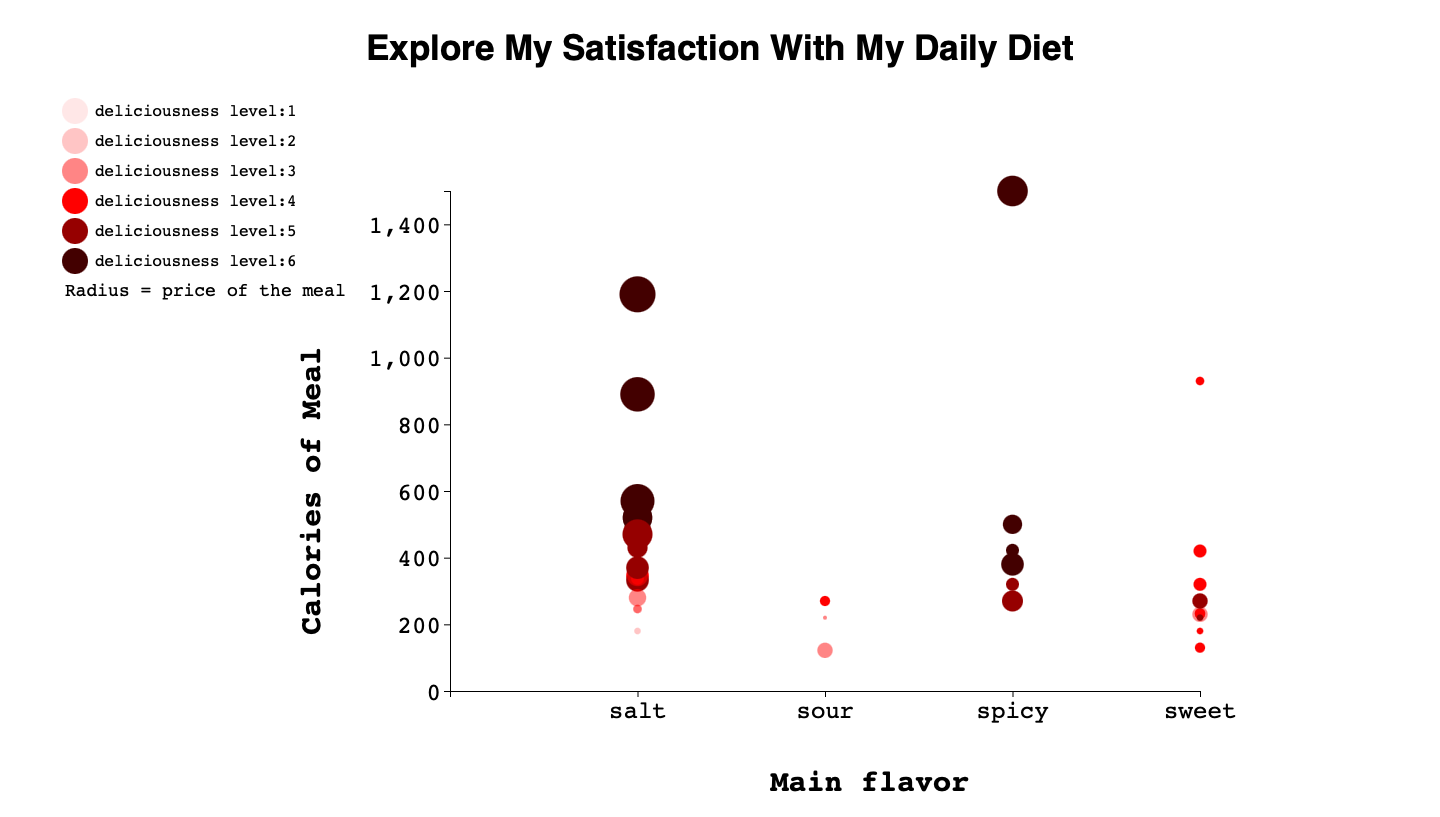
数据属性:
1. 时间(2021年1月9日至2021年4月4日)
2. 用餐类型(早餐、午餐、晚餐及零食)
3. 餐食价格(0-200美元)
4. 餐饮类别(美式餐点、中式餐点及其他餐点)
5. 主要风味(咸、辣、甜、酸、苦)
6. 餐食热量(0—2000千卡)
7. 膳食含糖量(0克—200克)
8. 膳食蛋白质含量(0克—200克)
9. 饱腹等级(0至6级):0级表示非常饥饿;3级表示不饿;6级表示非常饱
10. 美味程度(0至6级):0级表示非常难吃;3级表示味道尚可;6级表示极其美味

数据搜集中遇到的挑战:
有时我无法获取某餐的详细卡路里数据,因此会借助WebMD网站的NOURISH功能来估算近似数值。至于主要风味属性,当遇到食物同时具有多重特征(例如辛辣与咸味交织,或咸味与酸味并存)时,我会依据用餐时的实际感受来确定主导风味。
另一个技术难点在于将JSON格式的数据提取并呈现在HTML页面上。根据JSON规范,数据格式应严格遵循带引号的格式(如:"main_flavor": "salt"),但HTML页面上却显示为不带引号的格式(main_flavor: salt)。因此我需要逐条检查数据,手动添加双引号以符合JSON语法规范,最后再将修正后的数据录入到data.json文件中。


研究发现:
从可视化图表中可以看出,一些面积较大(表示餐食价格较高)且颜色较深(表示美味程度较高)的数据点,更多地分布在y轴刻度的高值区域(即热量较高)。这一发现符合我的假设:热量较高的餐食通常价格更高,同时也能给我带来更高的用餐满足感。
结论:
我认为自己对餐食的满意度确实受到价格的影响,这份可视化图表也充分支持了我的假设。我通常倾向于选择餐厅中价格较高的餐品,且每次都会想尝试多种餐食,因此这些选择往往同时具备高价格和高热量的特征。另一方面,由于我的烹饪技巧有限,对自己制作的食物满意度普遍较低——换言之,在低价餐食中我难以获得较高的满足感。
图表还清晰显示了我对辛辣食物的明显偏好:辣味区域集中了大量颜色深沉(代表美味程度较高)的数据点。相反,在酸味区域则仅有少数颜色较浅(美味程度较低)的数据点分布,这说明我对酸味食物的喜爱程度确实有限。
更多详细内容